Sandform Guide
Introduction
This guide has been written with the aim of helping the reader navigate their way around the Sandform site and it also explains what all the different components mean, and how they all fit together.
The guide has been split into six different sections. As well as this introduction, they cover the full overnight race cards, the four-day private handicaps, the statistics pages and the Sandform Hotlist. At the end of the guide is an explanation of what the speed figures (which appear on the cards, private handicaps and the Hotlist) actually represent and the methodology behind their compilation.
One thing you may notice throughout the site is that the arrangement of items at the top of each page (apart from the Home Page) is the same. This has been designed to make navigation around the site easier in that wherever you are on the website, clicking on the link buttons will have the same effect. It also means you can reach any other page on the site easily without having to click on the ‘back’ arrow repeatedly in order to return to where you started from.
A brief introduction to the people behind Sandform appears on the Home Page as well as links to other interesting and associated sites, as well as each AW track’s website, but please remember to come back to the Sandform website afterwards!
There is also a link to start up your default email software if you should wish to send an email to sandform.co.uk.

Race Cards
The race cards and private handicaps are available by clicking on the ‘Cards’ button at the top of all pages on the site. Once you do this the following menu appears:
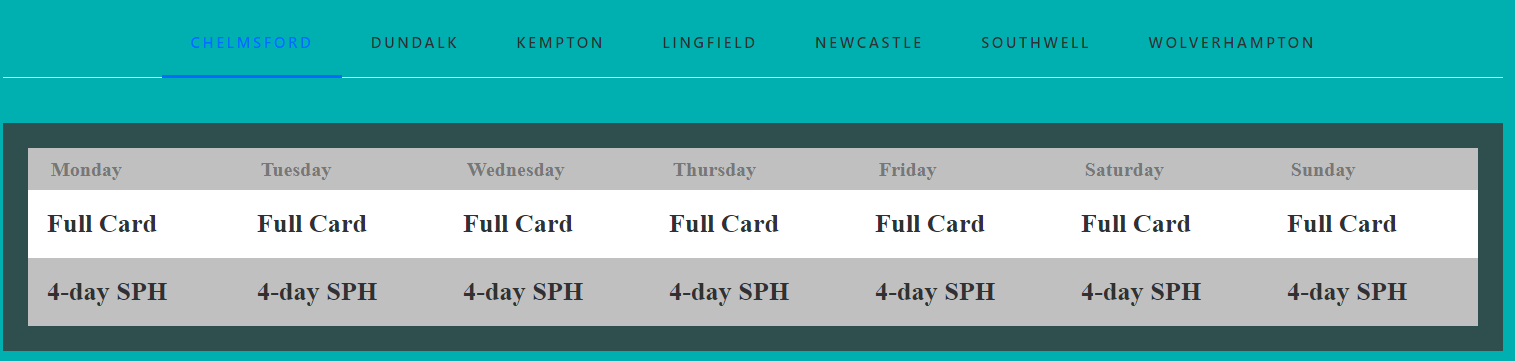
On this menu you find the meeting on the day of the week you want and click on the relevant ‘Full Card’ or ‘4-day SPH’ link. If you click on a ‘Full Card’, the full Sandform race card for that meeting will appear, providing it exists. If it doesn’t, a message will appear saying so with the option of returning to the ‘Cards’ menu.
Below is an example of how each runner is represented:
The race title is shown at the top together with the scheduled off-time, the race’s rating band (if relevant), the class, the eligible age-group and the winner’s prizemoney. The next line shows the distance of the race in furlongs, the class par (the standard speed figure for a race of this type), the number of runners and the Sandform median time for the distance. The median times are revised and updated during the summer.
The runners taking part in the race are then shown. The line starts with the horse’s saddlecloth number, then its draw, its name (three gold stars after the name means the horse is on the current Hotlist – see below), its age and the weight set to be carried before any allowances or overweight, together with any declared headgear *(Blinkers, Visor, Cheekpieces, Hood, Tongue-Tie, Eyeshield or Eyecover), and finally the trainer and jockey.
The next line shows the horse’s sire, trainer and jockey statistics at the track going back five seasons. In each category are shown (from left to right) the number of runs (rides), number of wins, percentage of wins-to-runs and finally the profit or loss to a £1 level stake.
Below this are details of the horse’s previous runs on All-Weather tracks in Britain and Ireland with the most recent at the top.
The columns shown from left to right are:
Date Of Race.
Name of Track.
Track surface: POLY (Polytrack), TPTA (Tapeta), FIBR (Fibresand) or DIRT.
Distance Of The Race In Furlongs.
Going Based On Race Times: VF – Very Fast, FT – Fast, SD – Standard, SW – Slow, VS -Very Slow.
Track Bias. On a scale of 0-100, the higher the figure the more the track was suiting front-runners.
Type Of Race. The initial number is the class of the race between 1 and 7.
Finishing Position.
Number Of Runners.
Actual Weight Carried (after overweight or allowances).
Draw The Horse Started From.
Pace Means Early Position taken: L – led or disputed, P – raced prominently, H – mid-division or near the back of the field.
Headgear (*see above).
Sectional Percentage (**see below).
Speed Figure.
**The Sectional Percentage is a way of assessing the shape of any given race. The speed figure on its own won’t tell you this, but the sectional percentage will and such information can prove invaluable.
The way this percentage is calculated is by measuring the time taken from the start of the race to the three-furlong pole and then take the time from there to the winning post. Comparing the two will show whether the field went fast early and then slowed, or went slowly early and then sprinted through the closing stages.
Anything over 100% means that in relative terms the pace quickened through the latter stages, while anything lower than 100% means they went a solid pace early and then slowed. A sectional percentage of 100% would mean that the race was run at a consistent pace throughout. In the example shown the sectional percentage is 108%, which means the race developed into something of a sprint finish.
Please note that the Sectional Percentages only came into being on September 1st 2024, so before that date the sectional column will be blank.
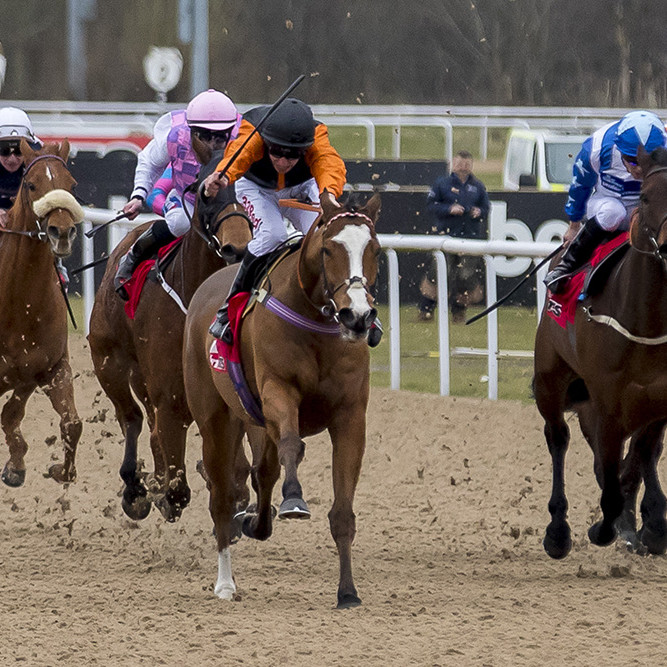
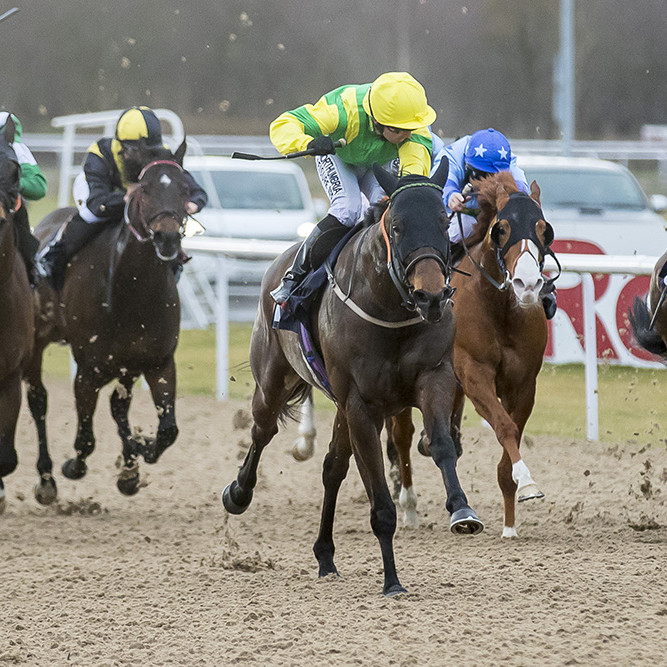
Big Country wins the 2018 Lincoln Trial at Wolverhampton
Below each race are shown the Impact Value (IV) for each running style over the distance, together with some draw statistics. The impact value give an idea of how each category fares compared to pure chance. In other words an IV of 2.0 would mean they win twice as often as they should, 0.5 half as often, and 1.0 about right.
| Front Runners | 1.5 |
|---|---|
| Prominent Horses | 1.2 |
| Hold Up Horses | 0.5 |
The draw statistics show the number of runners from each stall over the distance during the past year, the number of winners and the percentage of winners to runners from that draw.
| Stall | Rnrs | Wnrs | %w/r |
|---|---|---|---|
| 1 | 34 | 4 | 12 |
| 2 | 31 | 5 | 16 |
| 3 | 32 | 6 | 19 |
| 4 | 34 | 6 | 18 |
| 5 | 32 | 3 | 9 |
| 6 | 32 | 3 | 9 |
| 7 | 26 | 2 | 8 |
| 8 | 25 | 0 | 0 |
| 9 | 20 | 0 | 0 |
| 10 | 14 | 2 | 14 |
| 11 | 10 | 0 | 0 |
| 12 | 7 | 0 | 0 |
| 13 | 7 | 3 | 43 |
| 14 | 6 | 1 | 17 |
| 15 | 0 | 0 | 0 |
| 16 | 0 | 0 | 0 |
| 17 | 0 | 0 | 0 |
| 18 | 0 | 0 | 0 |
| 19 | 0 | 0 | 0 |
| 20 | 0 | 0 | 0 |
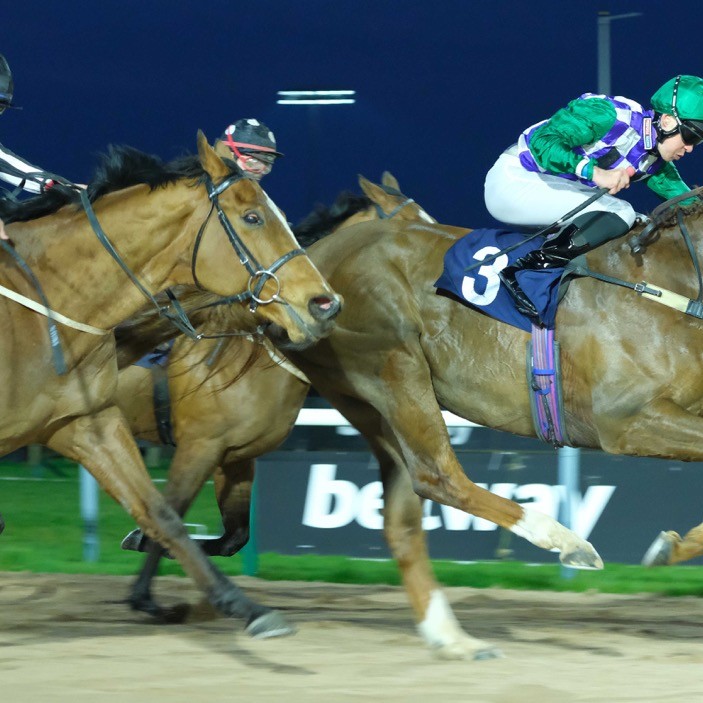
Lancelot Du Lac shows his class once again at Wolverhampton
Sunset at Chelmsford - the only way is Essex

Private Handicaps
If you have selected a Sandform Private Handicap (SPH) from the menu shown in Section 2, you will see something like this:
The Sandform Private Handicaps are generated four days before the fixture (three days for Dundalk) and are there to give a ‘taster’ of the racing to come. They are handy for starting research early, but bear in mind that horses often run with great regularity on the All-Weather, so there is every chance that a horse might have run again in between when the private handicap was generated and the target race.
Note that the speed figure string is made up of three components. The (up to three digit) number at the beginning of the string is the actual speed rating, whilst the two letters in the centre show the track where the rating was earned (a key showing what the abbreviations stand for appears at the end of the SPH). The last two digits are the distance of the race in furlongs rounded down.
A speed figure of 108Ke07 would mean the horse earned a rating of 108 over 7f at Kempton, whilst a speed figure of 109So12 would represent a speed rating of 109 over 1m4f at Southwell.
The fields are shown in 4-day race card order and the details shown from left to right are:
Horse’s Form Figures (on All-Weather tracks).
Horse Name.
Highest Speed Figure (since January 2018). If a horse has achieved its highest figure more than once then the most recent is shown.
Last Eight Speed Figures earned (the most recent on the right).
Statistics
If you select the ‘Stats’ option from the navigation bar, then the following menu appears:
| Chelmsford | Dundalk | Kempton | Lingfield | Newcastle | Southwell | Wolverhampton |
|---|---|---|---|---|---|---|
| Jockey Stats | Jockey Stats | Jockey Stats | Jockey Stats | Jockey Stats | Jockey Stats | Jockey Stats |
| Trainer Stats | Trainer Stats | Trainer Stats | Trainer Stats | Trainer Stats | Trainer Stats | Trainer Stats |
| Sire Stats | Sire Stats | Sire Stats | Sire Stats | Sire Stats | Sire Stats | Sire Stats |
You can then click on the relevant statistics from the table (note that the stats cover the last five seasons, that is the last four complete calendar years plus the current year so far) . For example, if you had selected ‘Sire Stats’ under the column headed ‘Chelmsford’, you should see something like this:
| Name | Rns | Wns | % | P/L(£1) |
|---|---|---|---|---|
| A.P. INDY | 1 | 0 | 0 | -1.00 |
| ACATENANGO | 2 | 0 | 0 | -2.00 |
| ACCLAMATION | 348 | 37 | 11 | -101.04 |
| AD VALOREM | 33 | 8 | 24 | +24.00 |
| AFLEET ALEX | 1 | 0 | 0 | -1.00 |
| AIR CHIEF MARSHAL | 1 | 0 | 0 | -1.00 |
| DAREDEVIL | 1 | 0 | 0 | -1.00 |
| DARK ANGEL | 276 | 41 | 15 | -44.64 |
| DARNAY | 1 | 0 | 0 | -1.00 |
| DATA LINK | 3 | 0 | 0 | -3.00 |
| DAWN APPROACH | 34 | 3 | 9 | -25.92 |
| DAYLAMI | 3 | 0 | 0 | -3.00 |
| DECLARATION OF WAR | 40 | 8 | 20 | -11.90 |
| HAT TRICK | 6 | 0 | 0 | -6.00 |
| HAVANA GOLD | 55 | 5 | 9 | -31.00 |
| HAWK WING | 4 | 0 | 0 | -4.00 |
| HEART’S CRY | 3 | 1 | 33 | -0.75 |
| HEERAAT | 11 | 1 | 9 | -8.50 |
| HELIOSTATIC | 1 | 0 | 0 | -1.00 |
| HELLVELYN | 43 | 1 | 2 | -40.38 |
| MOUNT NELSON | 101 | 10 | 10 | -7.42 |
| MUHAARAR | 1 | 0 | 0 | -1.00 |
| MUHTATHIR | 5 | 0 | 0 | -5.00 |
| MUJADIL | 5 | 0 | 0 | -5.00 |
| MUJAHID | 4 | 0 | 0 | -4.00 |
| MUKHADRAM | 15 | 2 | 13 | -2.09 |
| MULLIONMILEANHOUR | 54 | 7 | 13 | +13.50 |
| SHAMARDAL | 183 | 35 | 19 | -46.04 |
| SHAMI | 1 | 0 | 0 | -1.00 |
| SHANGHAI BOBBY | 1 | 0 | 0 | -1.00 |
| SHANTOU | 2 | 1 | 50 | +15.00 |
| SHIROCCO | 25 | 1 | 4 | -22.80 |
| SHOLOKHOV | 3 | 0 | 0 | -3.00 |
| SHOWCASING | 133 | 19 | 14 | -3.18 |
The Hotlist
The Hotlist is a record of horses who have put up a performance that was well in advance of the class they were running in, plus any entries they may have held when qualifying for the list. The Hotlist covers the preceding two weeks. Here is an example:
| Name | Date | Track | Dist | Class | Rating | Diff | Future Entries |
|---|
| WILD SHOT | 22MAR | DUNDALK | 10.7 | 6 | 109 | +8 |
| AGE OF WISDOM | 11MAR | KEMPTON | 16 | 4 | 113 | +8 |
| KNIGHT CRUSADER | 11MAR | KEMPTON | 16 | 4 | 113 | +8 |
| EXCHEQUER | 09MAR | KEMPTON | 7 | 3 | 115 | +8 |
| LOVE DREAMS | 09MAR | KEMPTON | 7 | 3 | 115 | +8 | 13MAR LINGFIELD 3-55 |
| SANAADH | 09MAR | KEMPTON | 7 | 3 | 116 | +9 |
| BALLISTIC | 09MAR | WOLVERHAMPTON | 7.2 | 4 | 109 | +9 |
The columns show from left to right:
Horse Name.
Date Of Race.
Name Of Track.
Race Distance (in furlongs).
Race Class (between 1 and 7).
Speed Rating.
Difference. This is the number of points the speed rating exceeded the par for the class of race. The higher the figure, the more likely the horse is to defy a rise in grade.
Future Entries (held at the time of qualifying for the Hotlist). These include races not on an AW surface.
The Hotlist is a valuable way of identifying horses who seem likely to follow up a big effort, including at a higher level.
Speed Figures
Unlike many other published speed figures, those shown in Sandform are not weight-adjusted and are not expressed in terms of pounds. They are expressed in terms of lengths-per-mile, so a horse with a highest speed figure of 105 should beat another with a highest speed figure of 97 by eight lengths over 1m should both horses run to their best. That’s the theory, though as we all know any theory can come up short when it comes to predicting flesh and blood. The speed figures are still an invaluable tool, though.
The reasons for not including weight in the calculations are many and varied, the main one being that no-one has come up with a satisfactory formula which explains how much ‘x’ amount of weight slows horse ‘y’ down over a trip of ‘z’. A big increase in weight probably will make a difference, but the difference will vary from horse to horse and we don’t know how much the horse itself weighs from one race to the next. This is important when applying the laws of physics to a combination of horse, rider, equipment and lead.
Another issue is that there can be confusion between weight and class. In other words you may hear that a horse has been found out by the extra 7lb, but that isn’t because they were carrying an extra 7lb in weight. It means that the horse had a 7lb higher handicap mark, pushing them into a higher grade, and that’s not the same thing. They may have even been carrying a lesser weight than in their previous outing. Class certainly does matter, hence the class pars used throughout this site, so you won’t find me underrating a rise in a horse’s official mark especially if it means they are tackling a higher grade.
Some years ago I conducted my own research to find out what sort of speed figure a horse would earn on my scale depending on the class of race they were running in. The results were surprisingly uniform, with a difference of around two lengths per mile between one class and those around it. As a result of this investigation I came up with this set of class pars used to calculate the speed figures:
| Class | Par | Class | Par | Class | Par |
|---|---|---|---|---|---|
| Group 1 | 117 | Class 2 | 109 | Class 6 | 101 |
| Group 2 | 115 | Class 3 | 107 | Class 7 | 99 |
| Group 3 | 113 | Class 4 | 105 | ||
| Listed | 111 | Class 5 | 103 |
The conclusion was that a standard Group 1 winner should beat a standard Class 7 winner by 18 lengths over a distance of 1m.
To allow for immaturity, the following deductions are made from the par figures for races confined to younger horses, depending on the time of year:
| Jan/Feb | Mar/Apr | May/Jun | Jul/Aug | Sep/Oct | Nov/Dec | |
|---|---|---|---|---|---|---|
| 2yo races | -11 | -10 | -9 | -8 | -7 | |
| 3yo races | -6 | -5 | -4 | -3 | -2 | -1 |
A further deduction of three points is made for races confined to fillies. So for example the par figure for a Class 4 handicap for 3yo fillies in May would be 98. That is 105-4-3.
Whilst the speed figures are not the ‘be all and end all’ on their own, they do give a strong indication of who the faster horses are given the right conditions. Don’t rely solely on a horse who has one big speed figure, but nothing else to compare with it. Any horse can be pulled to a fast time, but can’t achieve one when they have to do the donkey-work themselves. A selection of consistently high figures is a much better indication of a horse’s class, whilst steadily improving figures in a horse’s record are also worth looking out for, especially if the recent ones make the individual competitive for the class.